

Mid-tier gold producer
Gold processing plant dashboards
Four Power BI dashboards in four weeks for a mid-tier gold producer’s processing plant, saving more than 550…
>550
Hours saved per year
4
Dashboards delivered
4
Weeks to deliver
Site data and reporting
We map where the month-end numbers break between mine, plant and geology, fix the process, and report it in Power BI or Pit Info.
Most month-end packs are one workbook that five departments edit.
Fixed scope and price.
You get the problem in writing, an acceptance test and a priced next step. All three are yours to keep, even if you stop here.
Built on a copy of your data, not on your live systems.
It has to pass the acceptance test from the diagnostic before anything goes to site.
Installed on your network and signed off by your IT.
You get a runbook and two named owners on opposite rotations, so each rotation has an owner.
Once the system is running, support continues on a retainer.
System-down incidents get a 24/7 response.
Both rotation crews are trained, not only the one on shift at handover.
Training materials are in the site’s language.
Every phase ends in a go/no-go decision.
Mid-tier gold producer
Four Power BI dashboards in four weeks for a mid-tier gold producer’s processing plant, saving more than 550…
>550
Hours saved per year
4
Dashboards delivered
4
Weeks to deliver

West African Resources
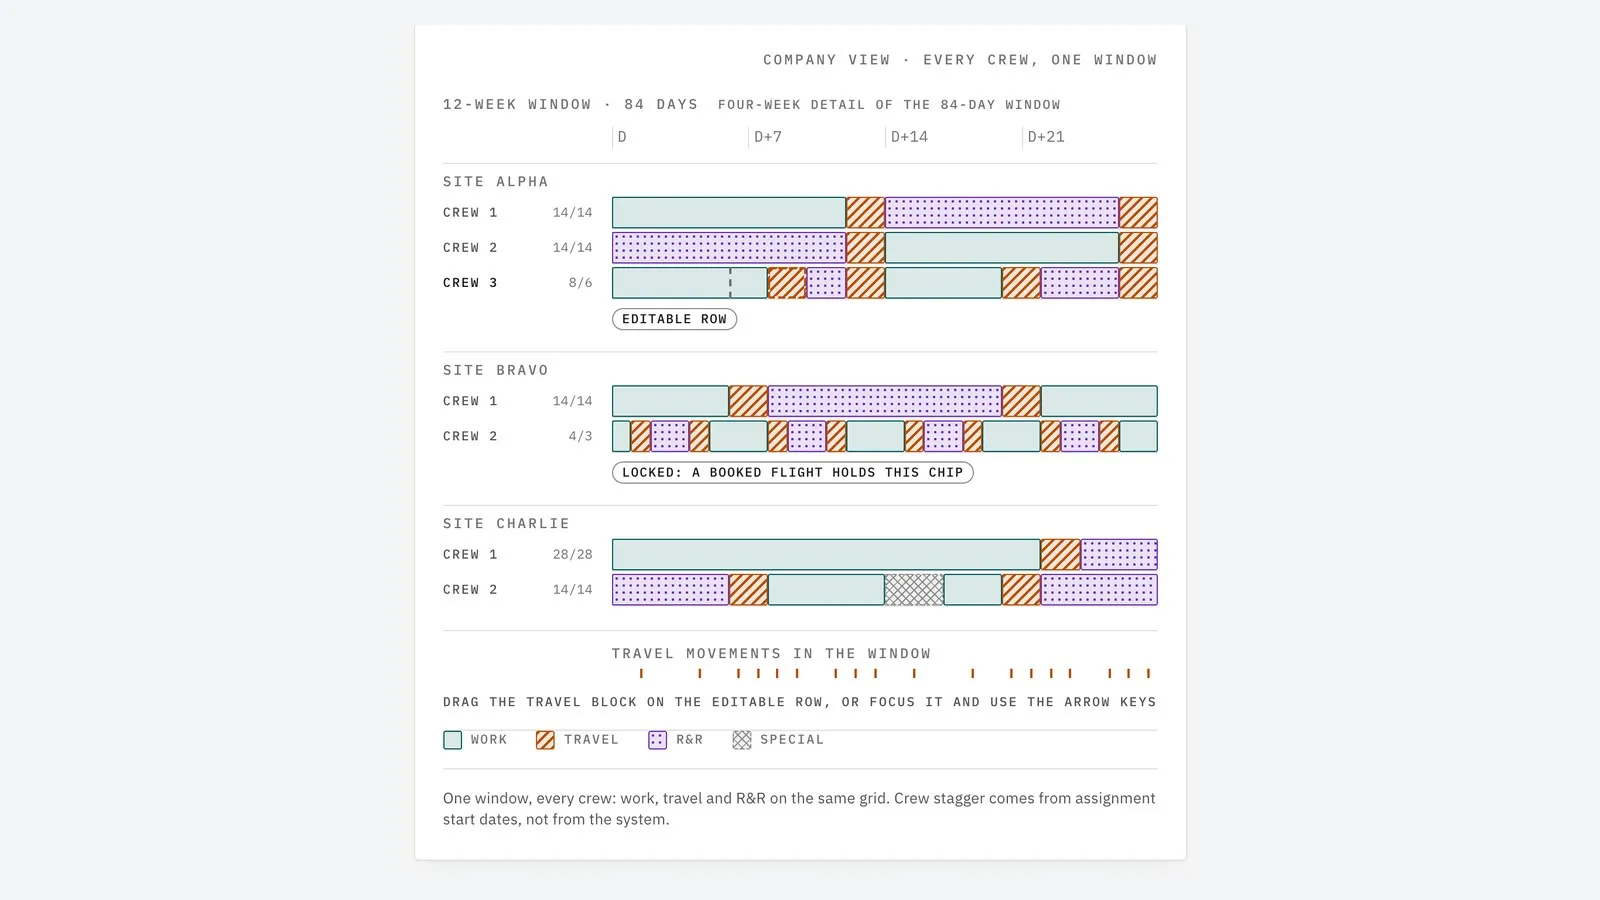
CrewCarry replaced spreadsheet travel booking at West African Resources in Burkina Faso: 90% fewer touch…
90%
Fewer touch points
100%
Travel booked with CrewCarry
2x
Booking agent productivity





“Minebright Inc. improved our reporting at Sanbrado by integrating Power BI, delivering near real time insights, clearer visualizations and better support for decision-making. Their team’s expertise and prompt responses ensured a smooth implementation, allowing us to stay focused on core operations. We recommend Minebright for practical solutions.”
Luke Holden
General Manager, Sanbrado Gold Operations
“The improvements that Minebright made to our reporting systems were a huge help to our team. Having near-real time insights into every aspect of construction progress allowed me to focus my efforts where they were most needed and contributed to the Abujar Gold Project being delivered on-time and on-budget.”
Daniel Kotzee
Construction Manager, Tietto Minerals

In its site data and reporting service, Minebright traces one month-end end to end, from the pit to the management report, and finds where the numbers diverge between mine, plant and geology, and why. Then we fix the process, with or without new software, and build the reporting in Power BI on Pit Info data or in Pit Info’s own reports.
On most sites the month-end pack is one workbook that five departments edit. It is rebuilt by hand by the one person who knows how, and variances get explained in emails instead of fixed in the process. Minebright’s site data and reporting service finds where the numbers diverge, and why, then fixes the process.
Not necessarily. Minebright’s site data and reporting service fixes the month-end process with or without new software. When the reporting is rebuilt, it is built in Power BI on Pit Info data, connected through Pit Info’s API or a direct database connection, or delivered in Pit Info’s own reports.
Every Minebright engagement starts with a diagnostic of fixed scope and price. You get the problem in writing, an acceptance test and a priced next step, all yours to keep even if you stop there. A prototype built on a copy of your data, site deployment, support and training follow, and every phase ends in a go/no-go decision.